Claudia, Danny, Michael, the U7 & Me
David R. Kotok, September 15, 2024
(The following was first published on The Kotok Report website and via LISTSERV. For details, visit https://kotokreport.com/.)
I found Michael Gayed’s summary of the recent labor market outcomes succinct and clear. He wrote:
If you were waiting for the labor market to save the soft-landing narrative this week, you probably found a lot to be desired. The all-important non-farm payroll number came in below expectations, but with the unemployment rate ticking down to 4.2%, the narrative is likely to continue that the labor market is slowing but a collapse isn’t imminent. If you take those numbers in conjunction with other labor market data released this week, the concern level should be higher. The Challenger job cuts number shot way higher in August. The JOLTS job opening report looked much worse than expected. The ADP employment report showed a smaller increase than forecasted. In the past, you could argue that some numbers looked good, some not so much, so there was no major imminent risk to the labor market contracting. Now we’re starting to see a pretty strong consensus across the board that it is contracting, maybe even accelerating, and this could be the domino that ends up tipping the economy.”
(“Very Risk-Off Behavior,” https://leadlagreport.substack.com/p/very-risk-off-behavior)
Many commentators reflected in a similar way about this mixed-message package. Conclusions, too, were mixed. Soft landing? Recession? Inverted yield curve? No more inverted yield curve? Any reader who follows the financial markets can list a hundred citations that illustrate the diversity of views.
Here’s mine.
First, the Kotok Rule is “Admit you don’t know when you don’t know.” Stop the publishing alarmist predictions about a coming catastrophe. All those who predict turmoil and outrageous attention-getting outcomes are simply guessing. Nostradamus was NOT a financial or economic analyst.
Second, respect serious research that has a long history. An example is the work of Claudia Sahm, Chief Economist at New Century Advisors (https://newcenturyadvisors.com/about-us-2/). Her eponymous rule is a tribute to the effort she spent identifying economic indicators that offer guidance. Claudia is not known for exaggeration. She is known for identifying an economic relationship on the basis of data. The Sahm Rule states that the early stage of a recession is signaled when the three-month moving average of the US unemployment rate is half a percentage point or more above the lowest three-month moving average unemployment rate over the previous 12 months. But boiled down, the Sahm Rule simply tells us this: If X happens, history shows that Y will happen. That is no guarantee of the future, but it reflects what happened in the past. Claudia will tell you just that, if you pay attention.
My friend and fellow fishing aficionado Danny Blanchflower identified an indicator that was helpful to me as the Covid shock occurred in the labor markets. Danny is a full professor at Dartmouth, a labor economist by training, and was on the Monetary Policy Committee of the Bank of England (https://economics.dartmouth.edu/people/david-graham-blanchflower). He is also a fellow in the College of Central Bankers within the Global Interdependence Center, (www.interdependence.org). I look forward to seeing him at the NY GIC December meeting. His research about the Sahm Rule and OECD countries is in the reading list below.
Danny’s helpful indicator is something he labeled the U7. The notion is to find a sensitive rate-of-change indicator within the monthly BLS labor force data stream and examine it to see if it is an early warning sign of something serious coming soon. Note that the U7 does not officially exist. The current series of various unemployment categories came into existence in 1994 and stops at U6. 1994 is when the expansion of various subsets was introduced. The U3 is still the major headline-grabbing number every month. A link to a discussion by TLR Analytics of the latest BLS revisions is in the reading list below.
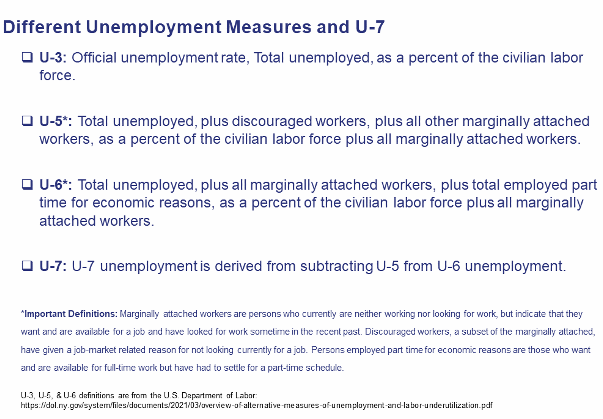
The discussion that follows will refer to these unemployment measures:

To get the U7, one must take the U6 and subtract the U5. I know I have just lost a lot of readers, but I trust the serious ones are still with me. The idea behind the U7 is that it isolates the most sensitive and fragile subset in the labor statistics cohort. So, at full employment the U7 stops falling because all the jobs the U7 cohort are seeking have been filled by U7 persons and those remaining are a level reached which is essentially a floor. Hence, the U7 has reached its low. Remember, there are levels of full employment and when they are reached the unemployment rate for that cohort is still above zero.
The reverse is true when unemployment is high in a recession. There are levels of peak unemployment for a cohort and the top is not 100%.
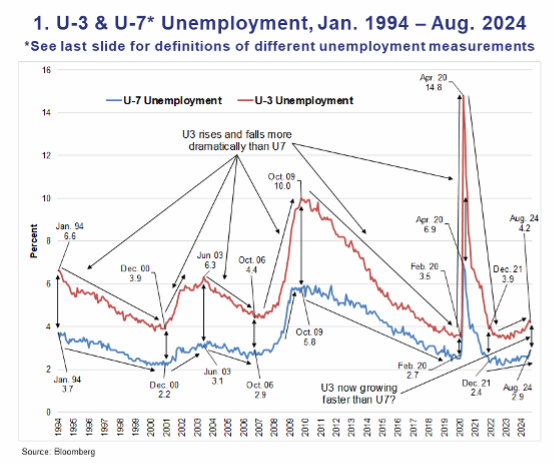
The key, IMO, is in the rate of change (gamma) within the directional rate of change (delta). When U3 is falling faster than U7, the economy is robustly improving. When they level off at low points, the labor force is fully employed. In a fully employed economy the most fragile cohort, the U7, is fully employed, so the U7 stops falling. When there is a directional change and U3 starts to rise faster than the U7, the economy is weakening; and this is a recession warning. Remember, the U7 cohort is very small compared with the total labor force.
Now, the gamma of U7 is not a certain predicter; it is a warning. And it is warning us right now. Furthermore, we may know more about the warning very soon, since in the last data report the U3 ticked down a smidge but the U7 continued to rise. Was the U3 a head fake for economists and therefore for financial markets? We shall see. Is the U7 uptick suggesting that the labor market is not as robust as some think and is worsening? We should soon know. Remember, U7 is the most fragile cohort.
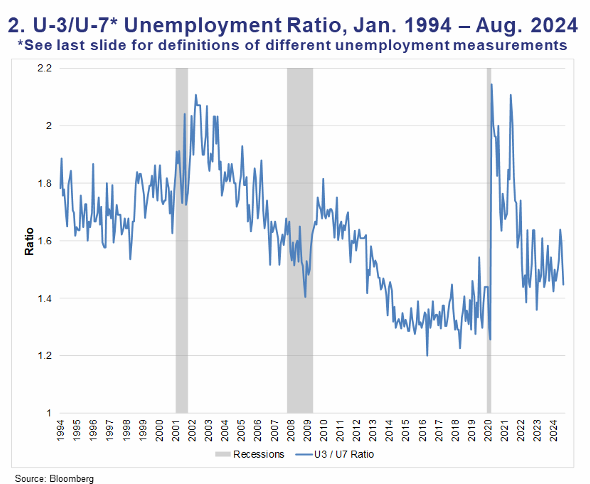
Below are a few charts. They show the history of the U7 and the U3, and they attempt to identify the turning points. Note the most recent entries. They show how the rate of change looks graphically. And they show how to compute the U7 so everyone can follow this for themselves. Many thanks to Danny Blanchflower for his original work on this item. And compliments to Claudia Sahm for her work on the “rule.” And to Michael Gayed for his succinct summary of where we are.
And applause for so many others who are seriously focused on using the labor market statistics for economic policymaking purposes. I include the cohort of professionals who assemble this data and the staff at the BLS. They work diligently, get ridiculed by politicians and cannot “fight back.” Just try to imagine what US labor force data would look like if there were no independent data agency compiling these statistics.
All errors are mine. Hat tip to Tom Patterson, who assisted me in making the definitions chart above and the two charts that appear below. The two below show the U7 and the U3. The second one is a ratio depiction of the U7 and the U3, so readers can follow the movement of this unusual indicator for themselves.


Reading List
“Talk of Fed Rate Cut Turns to How Big It Will Be,” https://www.bloomberg.com/news/newsletters/2024-09-07/bloomberg-weekend-reading-talk-of-fed-rate-cut-turns-to-how-big-it-will-be
“The 2024 Benchmark in a 32-year Frame,” https://www.tlranalytics.com/employment-productivity/the-2024-benchmark-in-a-32-year-frame/
US Bureau of Labor Statistics, https://www.bls.gov/
We thank Torsten Slok, Chief Economist and Partner, Apollo Global Management, for recommending the following three articles.
“Fed: US labor market likely softer than it appears,” https://www.minneapolisfed.org/article/2024/fewer-openings-harder-to-get-hired-us-labor-market-likely-softer-than-it-appears
“THE SAHM RULE AND PREDICTING THE GREAT RECESSION ACROSS OECD COUNTRIES,” https://bpb-us-e1.wpmucdn.com/sites.dartmouth.edu/dist/5/2216/files/2022/03/the-sahm-rule-and-predicting-the-great-recession-across-oecd-countries.pdf , “THE ECONOMICS OF WALKING ABOUT AND PREDICTING UNEMPLOYMENT IN THE USA,” https://www.cambridge.org/core/journals/national-institute-economic-review/article/economics-of-walking-about-and-predicting-unemployment-in-the-usa/8F4F0396614FFAEC455BDA8287C5596E
