High-Tech Bubble Valuation? I’m Not So Sure!
David R. Kotok, June 11, 2004
(The following was first published on Cumberland Advisors’ website and via LISTSERV. For details, visit https://www.cumber.com/.)
While respectful citizens observed D-Day commemorations, 80 years on, another invasion occurred on June 6th of this year. Barron’s summarized it like this:
Microsoft (MSFT), Apple (AAPL) and Nvidia (NVDA) are each worth a little more than $3 trillion. Nvidia’s market capitalization edged past that milestone on Thursday afternoon for the first time. As a result, this trio now makes up more than 20% of the entire $44.4 trillion market value of the S&P 500.
(“Nvidia, Microsoft, Apple Form Their Own League. Why Other Stocks Can Play Catch-Up, and 4 Other Things to Know Today.“)
What does it mean when 20% of the $45 trillion total market cap of the S&P 500 Index is found in these three stocks? Please note that the top ten stocks are now 35%. Also note the discussion of Matt McAleer about cap weight (SPY) versus equal weight (RSP). See Matt’s YouTube on this subject (https://www.cumber.com/week-review).
The financial press is replete with comparisons to the dot-com bubble of 1999–2000. Readers can find comparative comments about Nvidia’s stock split and the Cisco stock split of a quarter-century ago. Some say that Cisco split marked the top of the dot-com bubble. And they allege that the Nvidia split is doing the same. Maybe, but maybe not. Here’s why I say that.
I recall the dot-com bubble from personal experience. I guess that is the benefit of being an “old guy” who still has some (at least?) of his memory functioning.
I recently listened to a 40-year-old so-called “expert pundit” hold forth about the current market valuation, and I thought to myself, “He was 15 years old. He has no idea what it was like to manage money then.” He has no idea what it was like to get fired by a client who owned 6 tech stocks and nothing else and the client argued that he was diversified. And he had no idea what it was like to advise a client to hold a position to balance risk by owning a few 6% tax-free bonds (1999-2000). He was 15. Yup, the kid was 15!
Between 1999 and 2000, the combined market value of Cisco and Microsoft reached approximately $920 billion. The combined companies had earnings of $10 billion. That was a price/earnings multiple of around 92. Please note that at the time, if you totaled up the GDP of the countries of the entire world, the number was an estimated $30 trillion. That’s right, $30T for the entire world’s gross product and $920 billion of market cap for just two companies who earned $10B from that total world output.
Then, the problem was not with the two companies. Microsoft and Cisco were stellar enterprises with powerful balance sheets and growing revenues and income. The problem was the stock prices. 92 times earnings is simply an extraordinary price for anything that is a large cap.
The other problem with the dot-com bubble is that there were many, many companies that had no earnings. They traded at what I called the price/fantasy ratio. They were collectively valued in the single-digit trillions. No earnings and only possible prospects that were not realized and may never had been realized. So, fantasy is the word I chose to reflect that.
Is this time different? Those are the most dangerous words in the investing lexicon.
Here’s what is different. The three stocks at the top of the Barron’s list are all making money. The companies have had earnings growth for several years. They have had revenue growth for several years. The revenue growth is higher than the earnings growth. Readers are advised to independently check what I have said and determine the valuation for yourself. And the tax-free bond is paying 4% (still good, IMO) and not 6%. Feel free to discuss the way to balance these items with Matt McAleer or John Mousseau.
Earnings growing. Revenues growing faster than earnings. Great fortress-like balance sheets without debt burdens and without balance sheet sensitivity to changes in interest rates. Worldwide franchises. Whether that is worth $3T each or more is up to the investor. At Cumberland, we have exposure to the S&P 500 Index, and that means 20% of that exposure is in these three companies. Disclosure: I own SPY and I own tax-free Munis in my personal accounts.
For equity market details contact Matt McAleer, who can discuss how we manage the portfolio weights in the ETF strategies we offer.
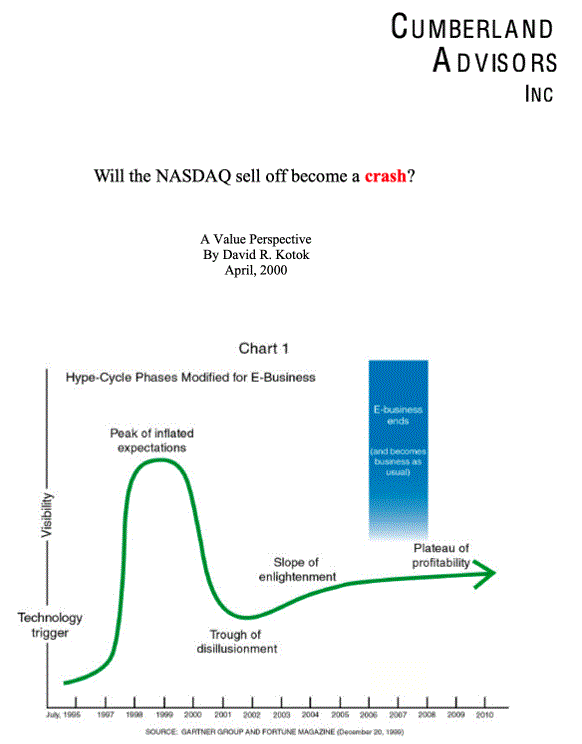
For history, please look at the piece I wrote and published almost a quarter-century ago. Title, “Will the NASDAQ sell off become a crash?”

